An order platform has outgrown its original Kafka cluster. Producer latency rises during traffic peaks, consumer lag takes longer to recover, and several brokers are close to their storage limits. The operations team adds new brokers and expects the load to spread automatically.
The new brokers join successfully, but the overloaded brokers remain overloaded. Existing partitions stay where they were, so the new capacity helps only with newly created topics. At the same time, a planned Kafka upgrade is approaching, monitoring covers CPU but not under-replicated partitions or consumer lag, and the disaster-recovery procedure has never been tested.
These are not separate operational problems. Scaling, upgrades, monitoring, performance tuning, and disaster recovery all depend on the same question: can the team change the cluster while preserving data safety, availability, and a clear understanding of system health?
This tutorial builds an operating plan for a self-managed Kafka platform. The scenario follows a production order-event cluster through capacity expansion, rolling upgrades, monitoring, tuning, and data-center failover.
The Production System
Assume the platform contains:
CheckoutService, which publishes order eventsPaymentService, which publishes payment resultsFulfillmentService, which consumes order and payment eventsCustomerTimelineService, which builds a customer activity view- Kafka brokers that store topic partitions
- KRaft controllers that manage cluster metadata
- Kafka Connect, Schema Registry, and client applications
- A monitoring stack based on JMX exporters, Prometheus, Grafana, and Alertmanager
The initial architecture looks like this:
Producers
   |
   v
Kafka brokers
  Broker A
  Broker B
  Broker C
   |
   +----> Fulfillment consumers
   +----> Customer timeline consumers
   +----> Kafka Connect pipelines

KRaft controller quorum
  Controller 1
  Controller 2
  Controller 3
The platform needs to support these operational goals:
- Add capacity without leaving old partitions concentrated on the original brokers.
- Upgrade controllers, brokers, and ecosystem components without a full outage.
- Detect disk exhaustion, replication problems, client delays, and silent processing failures.
- Tune throughput and latency without accidentally weakening durability.
- Recover from the loss of a broker, controller, or complete data center.
- Define acceptable downtime and data loss before selecting a disaster-recovery design.
Why Adding a Broker Does Not Rebalance Existing Data
A new broker joins the cluster after it receives a unique node identifier and the correct cluster, network, and security configuration. Existing broker configuration usually does not need to change.
The new broker becomes available for:
- New topic partitions
- Future partition assignments
- Explicit reassignment operations
Kafka does not automatically move existing partitions from old brokers to the new broker.
Before adding Broker D

Broker A: P0, P3, P6, P9
Broker B: P1, P4, P7, P10
Broker C: P2, P5, P8, P11

After Broker D joins

Broker A: P0, P3, P6, P9
Broker B: P1, P4, P7, P10
Broker C: P2, P5, P8, P11
Broker D: no existing partitions
The cluster has more theoretical capacity, but the old workload still uses the same disks, network paths, and partition leaders.
To benefit from the new broker, the team must reassign partitions.
Rebalance Partitions as a Controlled Migration
Kafka includes kafka-reassign-partitions.sh for changing partition placement. The tool can:
- Generate a proposed distribution across selected brokers
- Execute a prepared reassignment plan
- Verify the status of an active reassignment
- Change replication assignments
- Move data between log directories on a broker
The safe workflow is:
1. Inspect current broker and partition distribution
2. Select topics to move
3. Generate or prepare a reassignment plan
4. Review leader and replica placement
5. Execute the plan gradually
6. Monitor disk, network, replication, and client latency
7. Verify completion
8. Repeat for the next controlled group
Moving partitions consumes disk and network capacity because replicas must copy data to new locations. Reassigning too much at once can make the cluster less stable precisely when the team is trying to improve it.
Monitor during reassignment:
- Network bytes between brokers
- Disk input and output
- Under-replicated partitions
- Replica lag
- Produce and fetch request latency
- Consumer lag
- Broker CPU and memory
- Remaining free disk space
A new broker should also be added to client bootstrap server lists where appropriate. Bootstrap servers are initial contact points rather than permanent routing destinations, but including several valid brokers improves connection resilience and metadata discovery.
Remove a Broker Without Creating Under-Replicated Partitions
Stopping a broker is not the first step in decommissioning it.
If the broker still contains partition leaders or replicas, an immediate shutdown can create:
- Under-replicated partitions
- Offline partitions
- Unexpected leader elections
- Reduced failure tolerance
- Extra recovery traffic
Use this sequence:
1. Move partition leaders away from the broker
2. Reassign all replicas to surviving brokers
3. Verify that the broker owns no required partition data
4. Stop the broker gracefully
5. Remove or update its metadata where required
6. Remove its address from client bootstrap configuration
7. Confirm that no monitoring or automation still expects the broker
Tools such as Cruise Control can automate broker addition, removal, rebalancing, and optimization. That reduces manual planning but adds another operational component that must be deployed, secured, monitored, and understood.
Plan Kafka Upgrades as Ecosystem Upgrades
Kafka rarely operates alone. A production installation commonly includes:
- KRaft controllers or legacy ZooKeeper nodes
- Kafka brokers
- Kafka Connect
- Schema Registry
- REST Proxy
- Producer and consumer client libraries
- Operating-system and Java runtime dependencies
An upgrade plan that checks only the broker package can leave unsupported combinations elsewhere.
Before upgrading, validate:
- Operating-system compatibility
- Java runtime compatibility
- Broker and controller compatibility
- Kafka Connect compatibility
- Schema Registry compatibility
- REST Proxy compatibility
- Client-library compatibility
- Message-format and inter-broker protocol implications
- Deprecated or changed configuration properties
Kafka clients support strong compatibility between older and newer brokers, which makes staged upgrades possible. That compatibility should not become a reason to leave client libraries outdated indefinitely. Old clients may miss security fixes, stability improvements, and newer behavior.
Use a Rolling Upgrade Sequence
Kafka supports rolling upgrades, which allow one node to be updated at a time. A rolling upgrade reduces disruption, but only when the team validates each stage before continuing.
A practical sequence is:
Preparation
  |
  +----> Review release-specific migration guidance
  +----> Validate component compatibility
  +----> Back up Kafka and controller configuration
  +----> Test in a production-like environment
  +----> Prepare rollback and stop conditions
  |
  v
Upgrade KRaft controllers or ZooKeeper nodes
  |
  v
Validate metadata quorum and controller health
  |
  v
Upgrade Kafka brokers one at a time
  |
  v
Validate partition leadership, replication, and client traffic
  |
  v
Upgrade Kafka Connect, Schema Registry, and REST Proxy
  |
  v
Validate connectors, schemas, and integration traffic
  |
  v
Upgrade application clients through normal service releases
Automation through tools such as Ansible or Terraform helps keep the process consistent and reduces manual differences between nodes.
Before moving to the next stage, define explicit stop conditions:
- Offline partitions appear
- Under-replicated partitions do not recover
- Controller quorum becomes unstable
- Produce or fetch errors rise unexpectedly
- Consumer lag grows without recovery
- Connector tasks enter failed states
- JVM pauses become excessive
- Disk or network use reaches unsafe levels
A rolling upgrade is not safe merely because only one server is restarted at a time. It is safe when the cluster is observed and validated between changes.
Do Not Treat Replication as a Complete Backup Strategy
Kafka replication protects against individual broker failures by keeping partition copies on different brokers. It is not a traditional point-in-time backup system.
Organizations may create secondary data copies through:
- Kafka Connect sink connectors to external object storage
- Replication to another Kafka cluster
- Filesystem-level snapshots or custom backup processes
These approaches can protect data, but they do not automatically provide a simple, guaranteed point-in-time restore process.
A usable recovery strategy must answer:
- Which topics are protected?
- How frequently is data copied?
- Are schemas, connector configurations, ACLs, and topic settings included?
- How are consumer offsets handled?
- How is restoration tested?
- How long does restoration take?
- Which data may be missing after recovery?
- Who decides when the restored environment becomes authoritative?
A copy that has never been restored in a test is only an assumption.
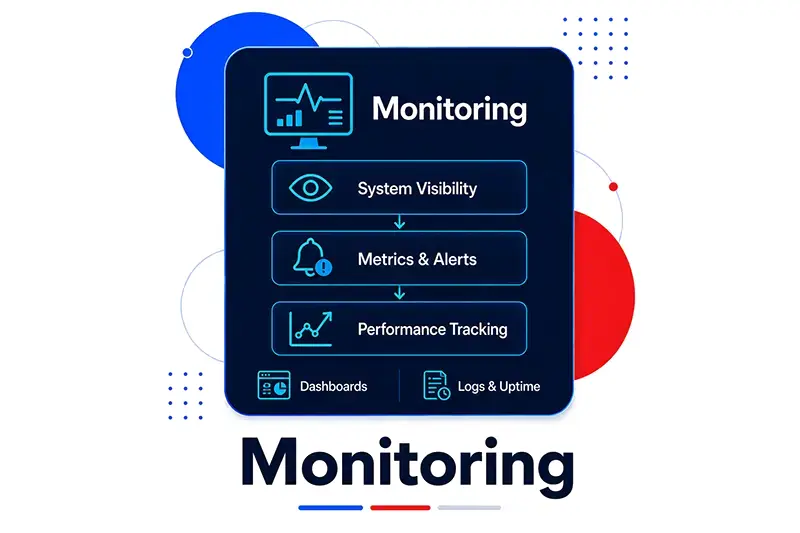
Monitor More Than CPU and Memory
Kafka monitoring should cover four categories:
- Business metrics
- Host-level metrics
- Java Virtual Machine metrics
- Kafka-specific metrics
Each category answers a different operational question.
Business Metrics: Is the Platform Producing Correct Outcomes?
Infrastructure can appear healthy while business processing is wrong.
Useful business metrics include:
- Events produced per business type
- Dropped, delayed, or duplicated events
- Failed enrichment or correlation attempts
- Join misses in stream-processing applications
- Payment events that never produce fulfillment actions
- Messages moved to a dead-letter topic
These measurements usually require application instrumentation, custom logs, interceptors, or stream-processing aggregations.
For the order platform, a useful chain is:
Orders accepted
      |
      v
Payments confirmed
      |
      v
Inventory reservations created
      |
      v
Orders dispatched
A large difference between stages can reveal a broken consumer even when every broker is running.
Host-Level Metrics: Can the Machine Sustain Kafka?
Monitor:
- Free disk space
- Disk throughput and latency
- CPU usage
- Network input and output
- Page-cache behavior
Free disk space deserves special attention because Kafka continuously appends records to log segments. A broker that exhausts storage can fail completely.
A threshold such as less than 15 percent remaining disk can be used as an example alert point, but the real limit must reflect growth rate and the time required to add or free capacity.
A better alert answers two questions:
- How much disk remains?
- How quickly is the broker approaching exhaustion?
JVM Metrics: Is a Java Pause Becoming a Cluster Failure?
Kafka brokers, Connect workers, and Kafka Streams applications run on the Java Virtual Machine.
Monitor:
- Heap and non-heap memory
- Garbage-collection frequency
- Garbage-collection pause duration
- Active thread count
- Class loading behavior
Long garbage-collection pauses can produce secondary failures:
Long JVM pause
      |
      +----> Producer requests time out
      +----> Consumer polling is delayed
      +----> Replica synchronization falls behind
      +----> In-sync replica set shrinks
      +----> Consumer lag grows
A JVM dashboard should therefore be correlated with Kafka request, replication, and lag metrics.
Kafka-Specific Metrics: Is the Distributed System Healthy?
Important Kafka metrics include:
- Offline partitions
- Under-replicated partitions
- Produce request latency
- Fetch request latency
- Metadata request latency
- Consumer lag by group and partition
- Controller activity and leader elections
- Bytes entering and leaving brokers
- Throughput by topic
- Producer record rates
- Producer batch sizes
- Compression ratios
- Kafka Connect task failures and state transitions
Consumer lag must be inspected per partition, not only as a group total. One hot partition can be far behind while an average appears acceptable.
Under-replicated partitions show that some partition copies are not synchronized. Offline partitions indicate that no usable leader is available. Both metrics directly relate to availability and durability risk.
Dead-Letter Topics Must Trigger Alerts
A dead-letter topic stores records that a consumer could not process. It lets the main consumer continue, but it does not resolve the failed business event.
A message may enter the dead-letter topic because of:
- Deserialization failure
- Business-rule rejection
- Downstream database failure
- Incompatible schema
- Repeated timeout
The monitoring rule should be:
Dead-letter record appears
      |
      v
Alert immediately
      |
      v
Assign ownership
      |
      v
Investigate root cause
      |
      v
Repair, replay, or close with an auditable decision
Without alerting and ownership, the dead-letter topic becomes silent data loss.
Share Monitoring Ownership Between Developers and Operations
Platform engineers understand brokers, controllers, storage, network paths, and cluster maintenance. Application developers understand event semantics, consumer behavior, processing latency, and failure handling.
A practical ownership split is:
| Metric area | Primary responsibility | Shared responsibility |
|---|---|---|
| Host and disk health | Platform or operations | Application capacity input |
| Broker and controller health | Platform or operations | Incident collaboration |
| Producer delivery errors | Application team | Platform support |
| Consumer lag | Application team | Platform visibility |
| Kafka Connect task state | Pipeline owner | Platform support |
| Dead-letter records | Business application owner | Operations alerting |
| Business event completion | Product and application teams | Platform correlation |
| JVM health | Service owner | Platform baseline |
The important point is that consumer lag cannot be ignored because the process is technically alive, and broker health cannot be ignored because the application logs look normal.
Build a Prometheus, Grafana, and Alertmanager Stack
Kafka components expose many runtime metrics through Java Management Extensions, or JMX. Prometheus does not scrape JMX directly, so a JMX exporter translates the metrics into Prometheus format.
Kafka broker or Java client
      |
      v
JMX metrics
      |
      v
JMX exporter
      |
      | HTTP scrape
      v
Prometheus
      |
      +----> Grafana dashboards
      |
      +----> Alert rules
                |
                v
           Alertmanager
                |
                +----> Email
                +----> Slack
                +----> PagerDuty
Prometheus stores time-series data. Grafana visualizes it. Alertmanager routes alerts to the responsible team.
Dashboards should support investigation rather than only decoration. An operator should be able to correlate:
- Disk growth with topic throughput
- Consumer lag with processing latency
- Replica lag with network saturation
- Request latency with garbage-collection pauses
- Dead-letter growth with deployment changes
- Leader elections with broker restarts
Tune Performance Only After Defining the Goal
Kafka can be tuned for different objectives:
- Lower latency
- Higher throughput
- Lower resource use
- Faster failure recovery
- Stronger durability
- Higher availability
Improving one objective can weaken another.
Larger batches can improve throughput but delay individual records. More replicas improve data safety but add replication work. A stricter minimum in-sync replica requirement improves durability but can reject writes during failures.
Before changing properties, write the objective:
Current symptom:
Consumer lag grows during order peaks

Target:
Increase sustained processing while keeping the agreed end-to-end latency

Constraints:
Do not reduce replication or acknowledgment guarantees
Do not increase duplicate business actions
Do not exceed current broker disk capacity
Then change one related group of settings at a time and measure the effect.
Balance Throughput and Latency
Producer settings involved in the tradeoff include:
batch.size=<tested-size>
linger.ms=<tested-delay>
compression.type=<tested-codec>
buffer.memory=<tested-capacity>
acks=<required-durability-level>
General effects:
- Larger batches can improve throughput.
- Longer linger time can fill batches more efficiently but increase waiting.
- Compression reduces network and storage use but consumes CPU.
- More buffer memory can absorb bursts but increases application memory use.
- Stronger acknowledgments improve durability but can increase latency.
Consumer settings include:
fetch.min.bytes=<tested-minimum>
fetch.max.wait.ms=<tested-wait>
max.poll.records=<tested-record-count>
max.poll.interval.ms=<processing-compatible-limit>
enable.auto.commit=false
General effects:
- Larger fetches can improve throughput.
- Smaller fetch thresholds can reduce waiting.
- Larger poll batches can process more records per request.
- Oversized polls can exceed the allowed processing interval and trigger rebalances.
- Manual offset commits provide more control but require correct application logic.
Broker-side controls include:
num.io.threads=<measured-value>
num.network.threads=<measured-value>
num.replica.fetchers=<measured-value>
socket.send.buffer.bytes=<measured-value>
socket.receive.buffer.bytes=<measured-value>
These values must be tested against the actual hardware, message sizes, partition count, network, and workload. Increasing every value does not guarantee better performance.
Balance Durability and Availability
A durability-focused payment pipeline might prefer:
acks=all
enable.idempotence=true
enable.auto.commit=false
isolation.level=read_committed
min.insync.replicas=<durability-requirement>
unclean.leader.election.enable=false
The surrounding design should also use an appropriate replication factor and commit consumer offsets only after processing succeeds.
An availability-focused log pipeline may accept weaker guarantees so it can continue during replica loss. That decision must be explicit because the cost can be missing records.
The tradeoff becomes visible during a broker failure:
Not enough in-sync replicas

Durability-first policy:
  Reject writes rather than risk acknowledging unsafe data

Availability-first policy:
  Continue with fewer guarantees and accept possible data loss
Do not apply one global policy blindly to every topic. Payment events and diagnostic logs can have different tolerance for downtime and data loss.
Define RTO and RPO Before Designing Disaster Recovery
Disaster recovery should be measured with two objectives:
- Recovery Time Objective, or RTO: The acceptable duration of service unavailability.
- Recovery Point Objective, or RPO: The acceptable amount of data loss measured from the failure point.
A team cannot choose between a stretched cluster, active-passive replication, and active-active replication without these requirements.
Option 1: Stretched Cluster
A stretched cluster places brokers across several data centers while they remain part of one Kafka cluster.
Data center A
  Controller
  Brokers

Data center B
  Controller
  Brokers

Data center C
  Controller
  Brokers
Configure broker rack awareness so replicas are distributed across failure domains:
broker.rack=region-a
Each data center uses its own logical rack value.
A KRaft quorum needs a majority of controllers. Three data centers provide the clearest design for surviving one complete site failure while retaining a controller majority.
A stretched cluster can target RTO equal to zero and RPO equal to zero because the surviving cluster continues operating with replicated data. The cost is additional cross-site latency and operational complexity. Synchronous replication requirements can affect producer acknowledgment time.
Option 2: Active-Passive Clusters
An active cluster serves producers and consumers. A second cluster receives data asynchronously.
Active cluster
  producers and consumers
        |
        | asynchronous replication
        v
Passive cluster
During a disaster:
- Replication may stop with a small amount of data not yet copied.
- Clients must be redirected.
- The passive cluster becomes active.
- Consumers and producers resume.
Because replication is asynchronous, RPO is greater than zero. Because redirection and activation take time, RTO is greater than zero.
This model uses two independent clusters and avoids stretching one quorum across sites, but failover must be automated and tested.
Option 3: Active-Active Clusters
Both clusters serve traffic and replicate data between them.
Region A cluster <---- asynchronous replication ----> Region B cluster
      ^                                               ^
      |                                               |
 producers and consumers                    producers and consumers
Automatic client redirection can provide an RTO of zero when one region fails. Asynchronous replication and writes in both locations can create conflict or data-loss risks, so RPO can remain greater than zero.
The architecture must define:
- Which cluster owns each key or topic
- How write conflicts are prevented or resolved
- How consumers avoid duplicate processing
- How clients discover the surviving region
- What happens when the failed region returns
Active-active is useful for global services that need low latency in several regions, but it has the highest coordination complexity.
Test the Operating Plan
Test 1: Add a broker
- Add a correctly configured broker.
- Confirm that it joins the cluster.
- Verify that existing partitions do not move automatically.
- Reassign a limited topic set.
- Monitor replication and client latency.
- Verify balanced disk and leader distribution.
Test 2: Remove a broker
- Reassign its leaders and replicas.
- Verify no required partition remains.
- Stop it gracefully.
- Update metadata and bootstrap configuration.
- Confirm the cluster has the expected replication health.
Test 3: Rolling upgrade
- Validate the upgrade in a production-like environment.
- Upgrade one component group at a time.
- Stop when defined health conditions fail.
- Verify client compatibility.
- Confirm rollback procedures before continuing.
Test 4: Consumer lag alert
- Slow one consumer deliberately.
- Verify lag rises for the affected partitions.
- Confirm the correct application team receives an alert.
- Restore processing.
- Verify that lag returns to normal.
Test 5: Dead-letter alert
- Publish an invalid test record.
- Confirm it reaches the dead-letter topic.
- Verify immediate alerting.
- Follow the documented repair or replay process.
Test 6: Data-center failover
- Simulate loss of the active site.
- Measure actual downtime against RTO.
- Measure missing data against RPO.
- Redirect clients.
- Verify producer and consumer recovery.
- Test how the failed site rejoins later.
Common Mistakes
Adding brokers and expecting old partitions to move
New capacity remains mostly unused until existing partitions are explicitly reassigned.
Reassigning too many partitions at once
Replica copying can saturate disk and network, increasing latency and replication risk.
Stopping a broker before moving its data
This creates avoidable under-replication and leader-election pressure.
Upgrading only the brokers
Kafka Connect, Schema Registry, REST Proxy, clients, the Java runtime, and the operating system also have compatibility requirements.
Delaying client upgrades forever
Protocol compatibility does not provide security fixes or performance improvements to an old library.
Monitoring only host health
A broker can have acceptable CPU use while partitions are offline, replicas are lagging, or consumers are far behind.
Monitoring consumer lag without ownership
An alert that reaches no responsible application team does not protect the service-level objective.
Creating a dead-letter topic without alerts
Failed records accumulate silently and become operationally invisible.
Tuning several properties simultaneously
The team cannot identify which change improved or degraded behavior.
Treating replication as a tested backup
Replica availability does not prove that a complete cluster can be restored after a regional disaster.
Selecting disaster recovery without RTO and RPO
The architecture cannot be judged if acceptable downtime and data loss are undefined.
Operating Checklist
Before changing a production Kafka cluster, confirm:
- The purpose and expected result of the change are documented.
- Broker and partition distribution has been measured.
- Reassignment scope is limited and reviewable.
- Disk, network, replication, and latency dashboards are ready.
- Rollback and stop conditions are defined.
- Controller, broker, ecosystem, runtime, and client compatibility has been checked.
- Configuration files are backed up.
- The change has been tested in a production-like environment.
- Offline and under-replicated partition alerts are active.
- Consumer lag is monitored per group and partition.
- Dead-letter topics trigger alerts with clear ownership.
- JVM pause and memory metrics are correlated with Kafka behavior.
- Performance goals are written before configuration changes.
- Durability and availability choices are made per workload.
- Data copies have a documented restore procedure.
- RTO and RPO are defined and measured during failover tests.
- The disaster-recovery topology has been exercised, not merely diagrammed.
Conclusion
Operating Kafka safely requires more than keeping broker processes alive. Adding brokers does not move existing data, rolling upgrades involve the entire ecosystem, and a healthy CPU graph does not reveal partition outages, consumer backlog, or abandoned dead-letter records.
A reliable operating model treats cluster changes as controlled migrations. Partition movement is observed, upgrades are staged, monitoring spans business outcomes through host resources, and tuning begins with an explicit tradeoff between latency, throughput, durability, and availability.
Disaster recovery completes the design. A stretched cluster, active-passive pair, and active-active deployment offer different combinations of downtime, data loss, latency, and complexity. Recovery Time Objective and Recovery Point Objective turn those choices into measurable requirements.
When scaling, upgrades, observability, tuning, and failover are designed together, new brokers become usable capacity, maintenance becomes repeatable, and a regional failure becomes a tested recovery event instead of an improvised crisis.